To succeed in the long term, a product must create real value. When it is deeply engaging and has high adoption, users will return to it frequently of their own volition. Most successful, healthy products can grow sustainably for long periods of time because they address fundamental problems.
Sustainable growth is growth that can be maintained without exhausting future resources. There is a trade-off between rapid growth today and growth in the future; rapid growth today may exhaust the addressable market and make it impossible to sustain your product over a longer period of time. For example, if your product is growing too quickly and new users are churning in large numbers, those users may never try your product again, and you will permanently lose the chance to make them active users. If instead your product grows slowly but retains a large percentage of users, it will likely grow more sustainably.
Most of the time, unsustainable growth is due to lack of product-market fit. A product that offers little to no unique value and grows purely through inorganic means is not likely to sustain itself over the long term. Furthermore, even when a product starts out growing sustainably, competition or market saturation may later dampen that momentum.
Understanding sustainable growth and how to create it is paramount to product success. In this post, we offer a framework you can use to determine whether your product is growing sustainably—as well as steps to take if it is not.
FRAMEWORK: KEY FACTORS
Fundamentally, sustainable growth depends on two key factors: product-market fit and positive net growth. The best indicator of product-market fit is retention; a great product not only gains new users at a healthy pace, but keeps those users coming back because they find value in the product.
The metric that best represents net growth is the “quick ratio,” or the ratio of the sum of new users and resurrected users to churned users. A successful product must have both a high retention rate (compared to successful products in similar genres) and a quick ratio of more than one, which indicates positive net growth.
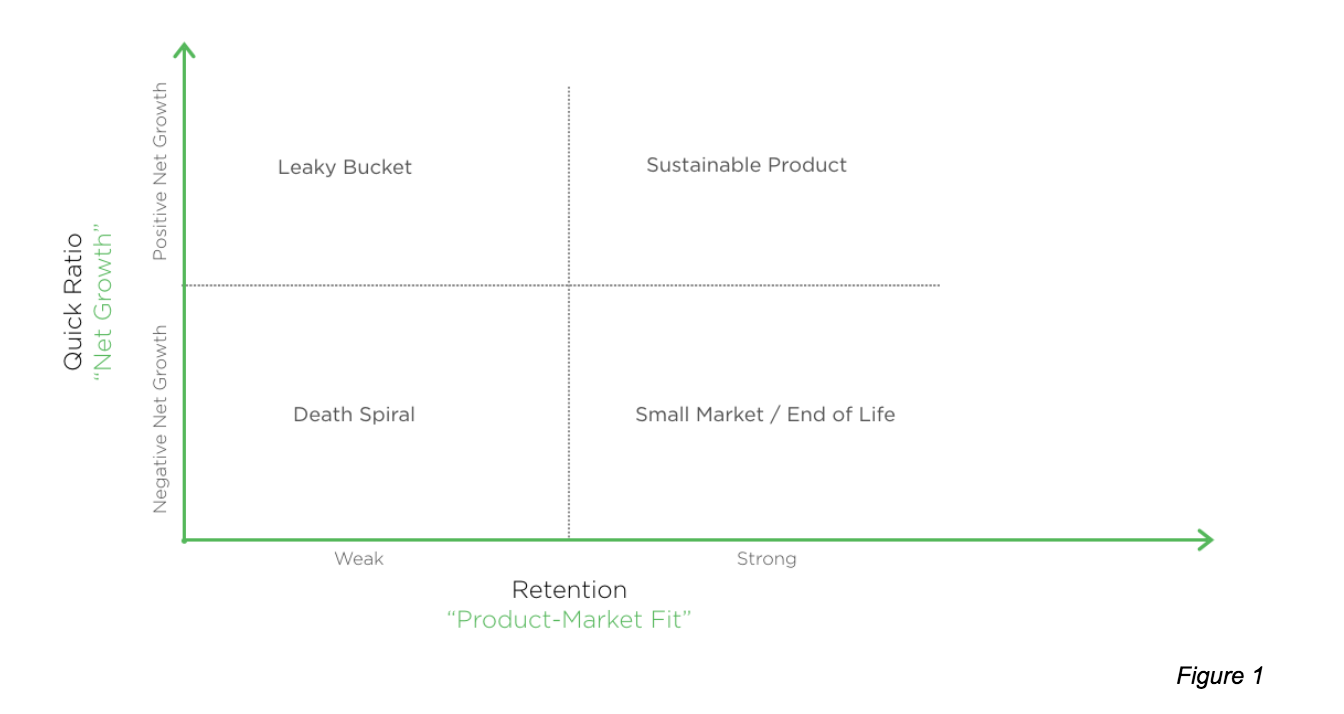
Based on these two key factors, the current growth status of your product may fall into one of four scenarios:
- Leaky bucket: The product has positive net growth but does not have product-market fit.
- Death spiral: The product has neither positive net growth nor product-market fit. Active users are declining with poor retention, and the product has little chance to succeed.
- End of life: Growth is declining, but the product has a core set of users that continue to retain. Early-stage companies experience this scenario when they find product-market fit with a small group of users but are losing active users overall.
- Sustainable growth: Active users are continuing to grow and users are retained well. This is the goal for all products.
In our exploration of these growth scenarios, we will review several case studies in which products evolved from one scenario to another—including one company that began as a leaky bucket and shifted to a death spiral, another that started out sustainable but has since transitioned into the end-of-life phase, and yet another that began as a sustainable product and remains so today.
LEAKY BUCKET
Characteristic metrics
- High quick ratio (> 1)
- Low retention rates
A leaky bucket product has positive net growth (meaning the overall number of active users is growing), but very few of those active users are retained. Generally, this happens when a product offers little or no unique value proposition for the majority of users—in other words, it has no product-market fit. Such a product may have acquired its users largely through viral, inorganic means or growth-hacking tactics. (Growth hacking aims to increase the user base as quickly as possible through content and product marketing using organic and paid channels.)
Case study: BranchOut BranchOut was a Facebook application launched in 2010 designed to help users leverage their social networks to build their professional networks. BranchOut used a growth-hacking tactic to attract new users; the app encouraged users to invite as many friends as possible by giving them only two options: send invitations to all friends or none. By manipulating Facebook’s referrals system, BranchOut quickly reached nearly 400M of Facebook’s monthly active users (MAU)—at the time, nearly half of the platform’s overall MAU. But most of these users were not genuinely interested in using the product.
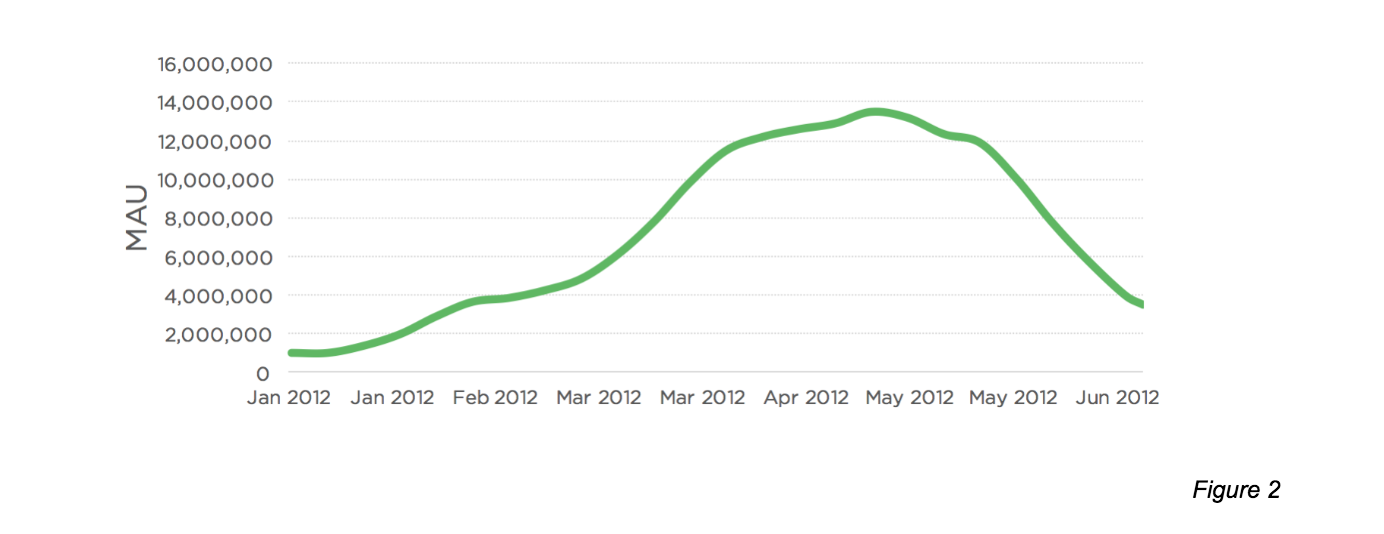
At the peak of its Hyper Growth phase, BranchOut had more than 12M MAU of its own and averaged more than 250,000 downloads per day for an entire month. However, as its invites penetrated more of Facebook’s user base, they often reached people who had already been invited and churned, rather than those who were new to BranchOut. As such, top-line new user growth slowed.
Moreover, less than one percent returned to BranchOut the day after they joined the platform. The app’s retention rates were extremely low because BranchOut provided no clear and differentiated value proposition and thus had no product-market fit; users came to the app, found little utility and left. BranchOut penetrated and churned through nearly all of its total addressable market and active users declined from 14M MAU to 3M MAU over a few months.
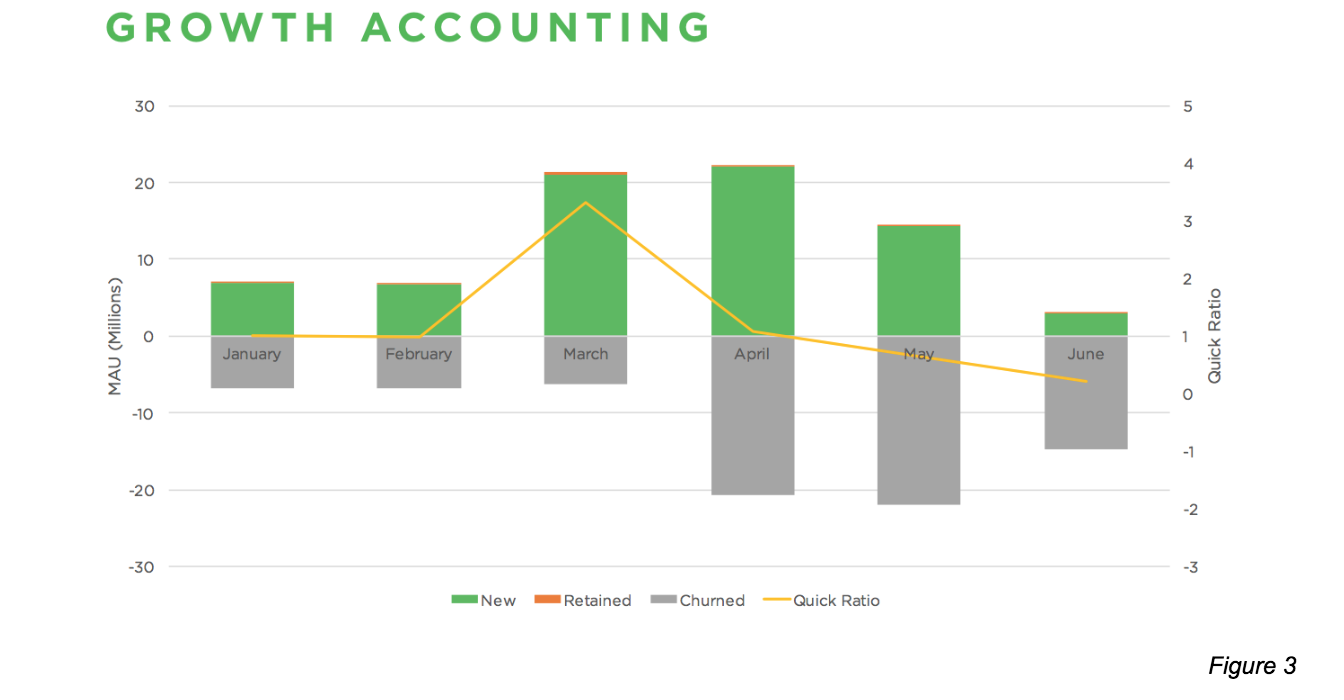
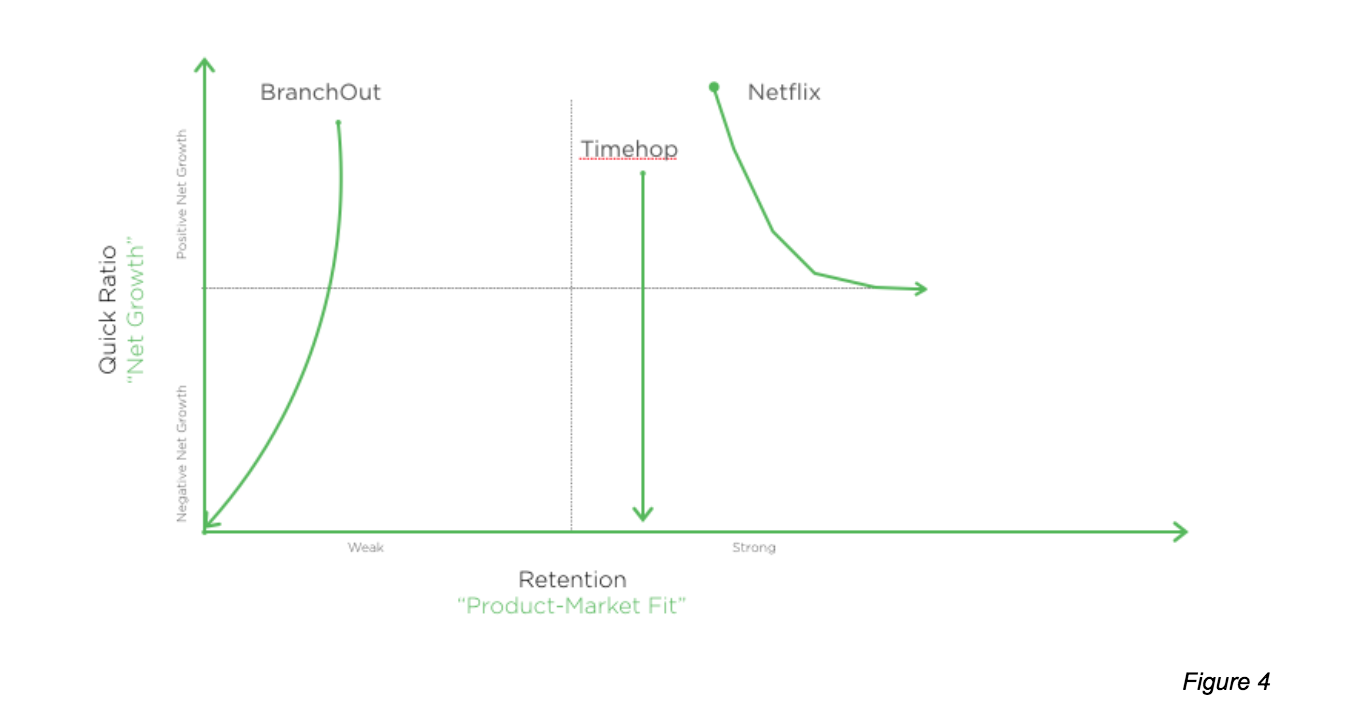
BranchOut started out as a leaky bucket with low retention and positive net growth, then rapidly moved to the death spiral scenario due to a combination of slowing new user growth and abysmally low retention rates (see Figure 4). This transition is reflected in the changes of the product’s quick ratio (see Figure 3), which had an an extremely high value (~3) as BranchOut grew in March, but declined soon afterward as most of the users gained in March churned at a rate that outpaced growth from new and resurrected users.
What can you do if this is your product? If your product is a leaky bucket, start by slowing down acquisition of new users and focusing on retention. Divert your attention to achieving product-market fit and ensuring that you have a core audience that loves your product and is deeply engaged with it. Use exploratory analysis to understand what keeps those most engaged users coming back to your product, then figure out how to make more users like them.
DEATH SPIRAL
Characteristic metrics
- Low quick ratio (< 1)
- Low retention rates
When a product is in a death spiral, it has negative growth and no product-market fit. As such, the quick ratio for a product in this scenario is less than one; churn outpaces resurrection and new user growth. Moreover, because the product offers little unique value, it is not retentive. As discussed above, “death spiral” is an apt description of BranchOut’s scenario months after its glory days.
What can you do if this is your product? If your product is in a death spiral, go back to the drawing board and rethink your product to determine how you can achieve product-market fit. Talk to customers and consider moving into different markets. Do not attempt to artificially stimulate top-of-funnel growth, as this will only lead you to churn through your addressable market and enter the unsustainable leaky bucket stage.
END OF LIFE
Characteristic metrics
- Low to average quick ratio (< 1)
- High retention rates
A product in an “end of life” scenario has a core set of highly-engaged users but is struggling to grow, perhaps due to high penetration of a target market or lackluster growth-hacking efforts. Two types of products generally fall into this scenario:
- Early Phase: When an early-phase product has high retention but is losing active users and does not have high penetration, growth tactics may help it reach sustainability.
- End of Life: This type of product likely started in a different scenario in its early phase before moving toward “end of life.” When such a product continues to lose users and fails to grow, but a small core of highly retained users is keeping it alive, the death of the product is inevitable.
What can you do if this is your product? First, understand the reason behind your sluggish growth. Perhaps you have penetrated your target market, but perhaps you simply have not yet identified all of the users who may love your product. If you do have high penetration, look for opportunities to begin a “second act” by leveraging your existing user base to pivot into a new market (this happens frequently in gaming).
If, however, you feel you have not yet penetrated your target market, sustainable growth may be well within reach, and you should consider investing in marketing and growth campaigns. In such a case, you may be able to capitalize on your ability to retain a core group of users who love your product, in order to catalyze growth.
SUSTAINABLE GROWTH
Characteristic metrics
- High quick ratio (> 1)
- High retention rates
When you have a successful product—that is, a product that users love and are highly engaged with and which retains users well—you can grow sustainably for a long period of time. Two types of products generally fall under this scenario:
- Single Act: A single-act company has found product-market fit and continues to grow sustainably until it achieves high penetration of the addressable market, when it naturally slows down. Eventually, churn and resurrection balance exactly, and net growth becomes zero. In many cases, such a company’s failure to adapt to competition or changes in the ecosystem will push it into the “end of life” scenario. (Timehop is an example of this, as described below.)
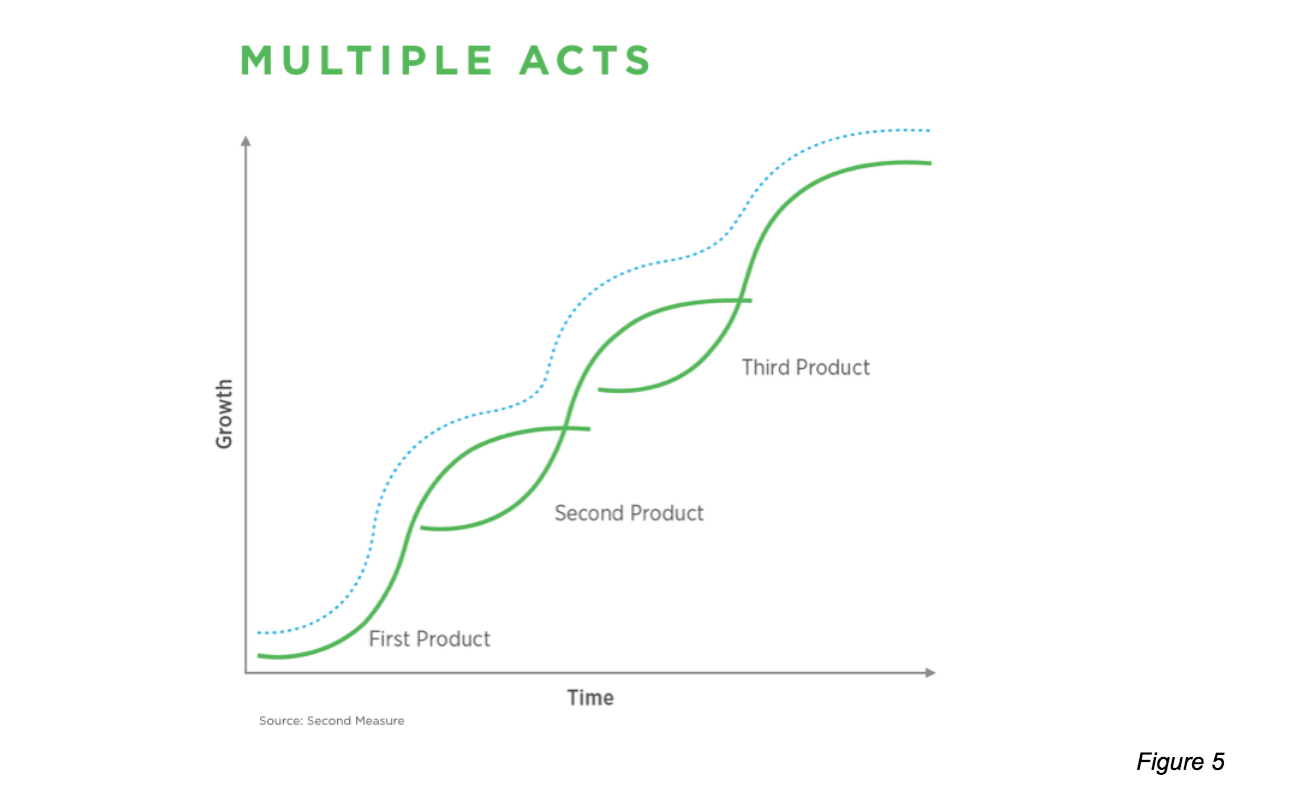
- Multiple Acts: A multiple-act company continuously evolves, building parallel products or expanding into new regions or verticals (see Figure 5). At such a company, the focus is on sustainable growth for each of its individual products, which allows sustainable growth for the company as a whole. Without multiple acts, a company will eventually move into an “end of life” scenario due to sluggish or negative growth. (For more on multiple acts, see the Netflix case study below.)
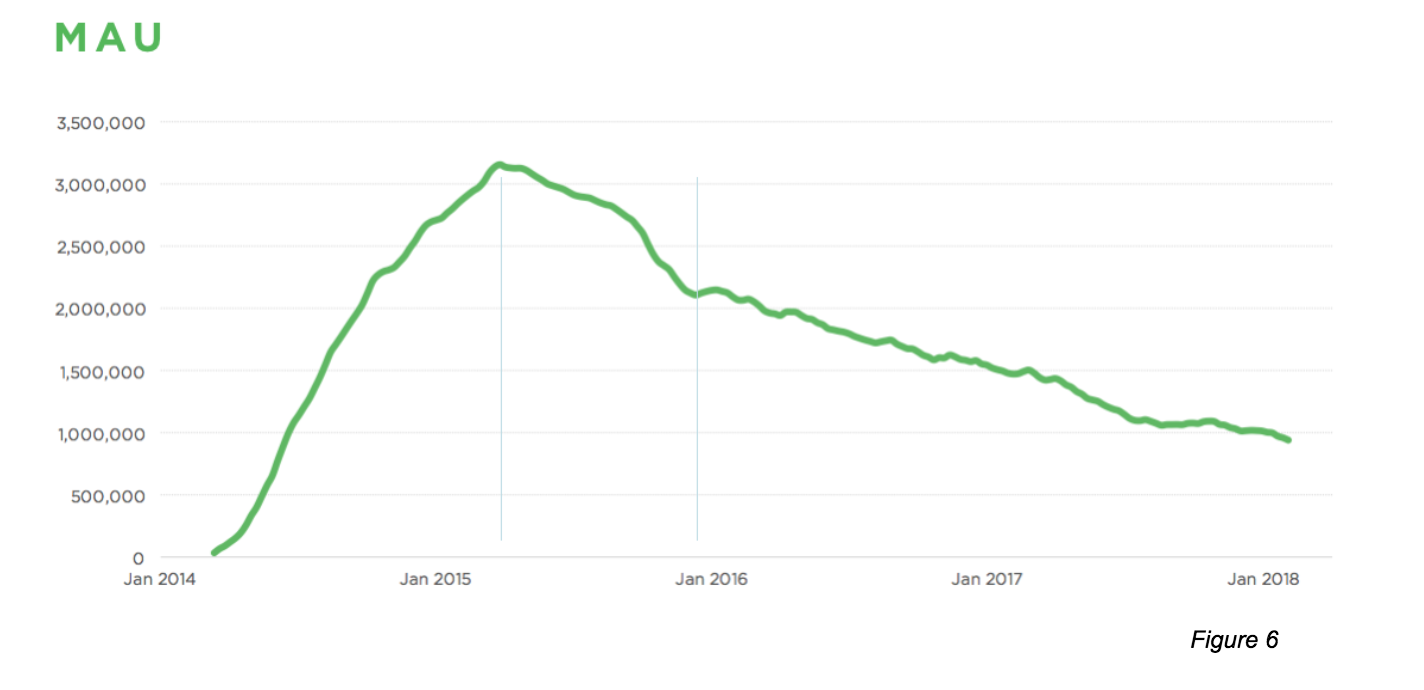
Case study: Timehop The Timehop app, which launched in 2011, is similar to Facebook’s “On This Day” feature; each day, it shows users the social media photos and other posts they shared on that date in previous years. At its peak around May 2015, Timehop had more than three million MAU on Android, most of whom were using the app on a daily basis (70 percent DAU/MAU ratio) and half of whom continued to use it after a month (50 percent D30 retention rate). By any measure, these stickiness and retention metrics seemed to suggest Timehop had product-market fit. As seen in Figure 6, however, Timehop’s MAU’s subsequently declined.
While the app enjoyed strong retention and significant growth, it was entirely notification-driven and engagement was poor. Users spent an average of one minute in Timehop after receiving a notification, and most did not open the app again for the rest of the day. Users were not returning “voluntarily” and averaged just one session per day.
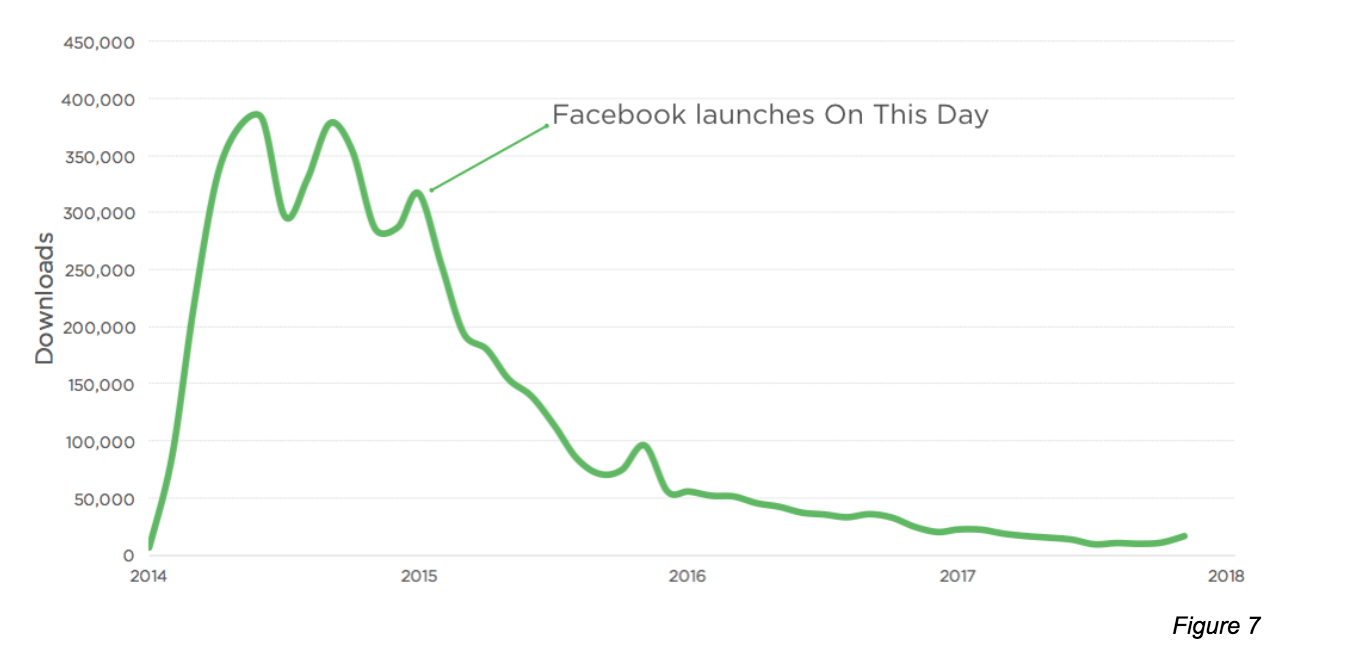
Furthermore, with the launch of Facebook’s “On This Day” in 2015, Timehop no longer provided a distinctive value and downloads decreased dramatically (see Figure 7). New users never installed it, those who had been active failed to reinstall when they bought new phones, and the app saw a gradual drop in usage. What Timehop failed to do was capitalize on its existing customer base and launch a “second act”; instead, the app simply fell out of popularity and moved to an “end of life” scenario.
Case study: Netflix Netflix is classic example of a highly retentive product that successfully executed multiple acts, which enabled significant success and sustainable growth while the company entered new markets.
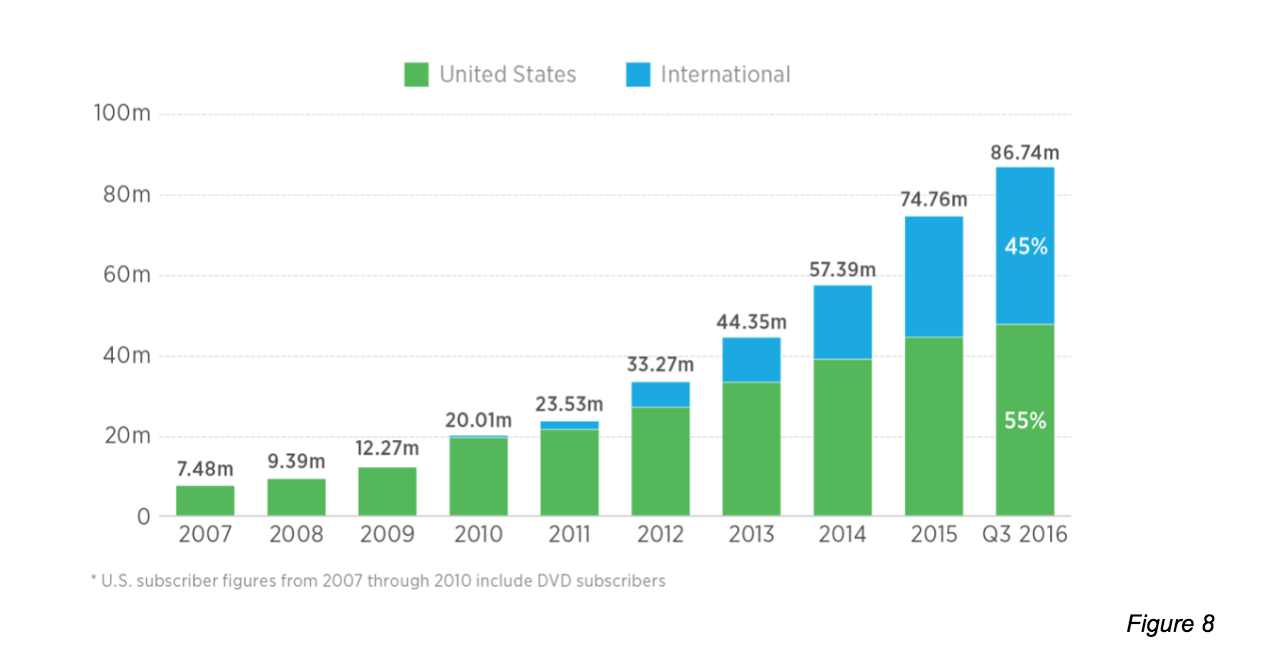
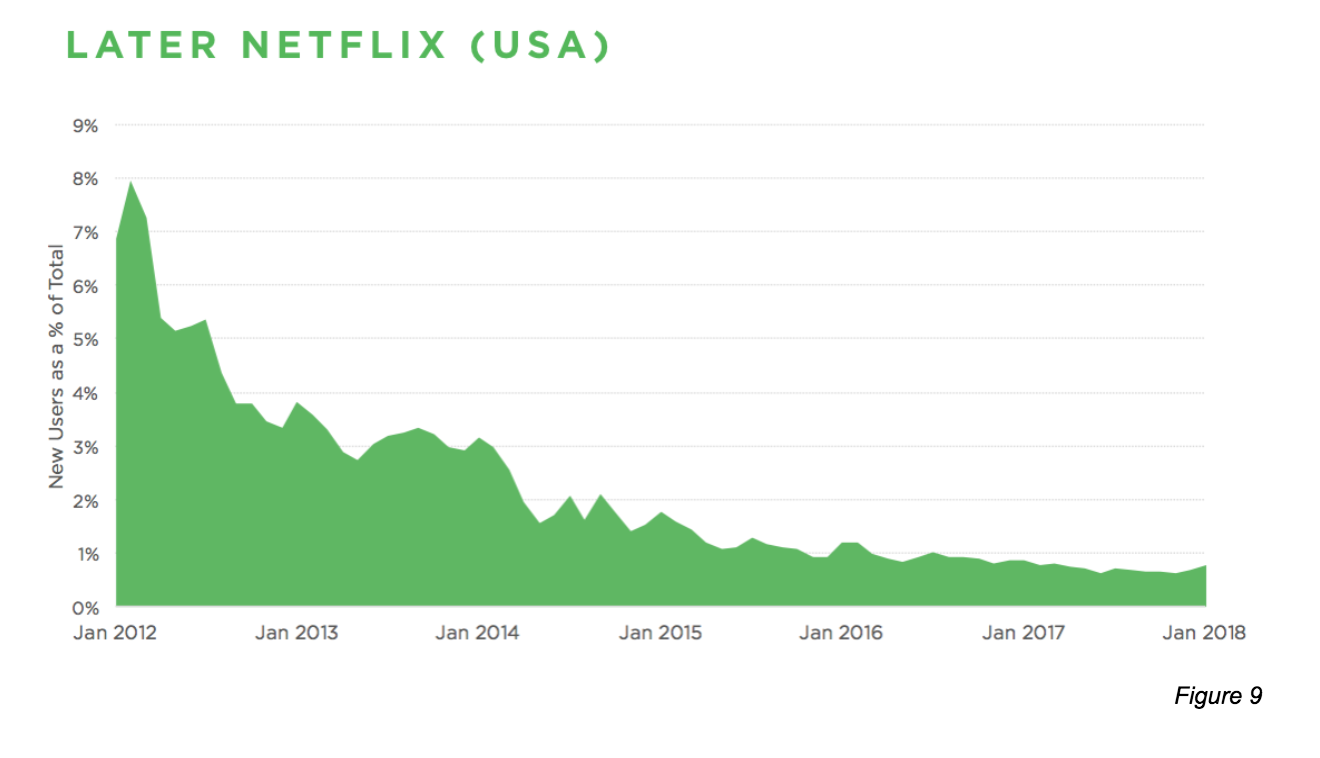
Netflix’s first act was its U.S. launch in 1997; it achieved and maintained product-market fit and growth from a single product for more than a decade. The company’s second act came when it expanded into new geographies: in 2012, new users in the United States accounted for eight percent of Netflix’s new users overall; by 2018, U.S. new users were just one percent of the total. Expansion into international markets allowed the company to continue healthy growth overall as its growth in the U.S. slowed (Figure 8).
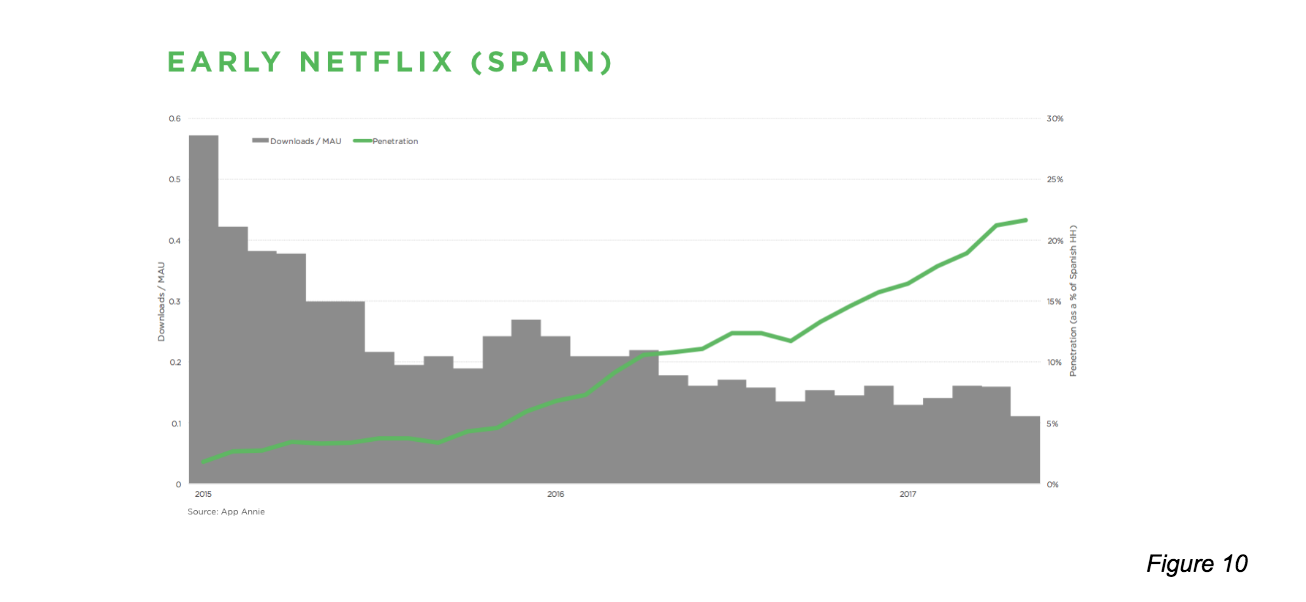
Recall the overlapping S-curves in Figure 5, where each curve represents a new product that individually exhibits sustainable growth. The same concept can be applied to Netflix’s expansion into new geographies; overlapping curves allow for continued growth even as the individual markets become saturated. Despite decreases in new users as a percentage of overall users in the U.S. (Figure 9) and Spain (Figure 10), for example, Netflix’s overall growth continued as the company launched in other new countries.
What can you do if this is your product? If your product is highly retentive and experiencing strong growth, make sure it continues by launching a “second act” during the growth phase of your product and capitalizing on your existing user base to fuel future growth. If you don’t launch a second act, your product can eventually fail.
OTHER APPLICATIONS
While we have discussed the use of this framework primarily at the company and product levels, it can also be applied to sub-products, events and features.
For example, in the case of a product such as Facebook, Reddit or Nextdoor, in which hundreds of millions of users are part of millions of “groups,” the product itself may have low retention and high growth (leaky bucket) while different groups map to all four scenarios, including sustainable growth. (The same applies to specific “tabs” within a product, such as “Explore” on Instagram, “Marketplace” on Facebook or “News Feed” on LinkedIn.) The product team’s goal should be to identify and understand what’s working well and attempt to make the overall product more like those successful groups or tabs.
The reverse may also be true: a product can grow sustainably overall while some individual features do not. Understanding growth at not only the product level, but also feature and event levels, can give you great clarity into overall success.
A NOTE ON ABSOLUTES
In this post, we did not use absolute numbers to define characteristics such “high retention rate” because the desired values of such metrics are highly dependent on the product and space. For example, a social media company would expect high daily retention, since people generally use such products daily. A travel app, however, might have a significantly lower daily or even monthly retention, since most people purchase plane tickets infrequently. To understand the success of your product, you must benchmark relative to similar products in the space.
TAKEAWAYS
- A product’s current growth status falls into one of four scenarios: “leaky bucket,” “death spiral,” “end of life” and “sustainable growth.”
- Retention (product-market fit) and net growth are the two key factors guiding sustainability of your product’s growth.
- Neither high growth without retention, nor high retention without growth, is sustainable in the long term.
- If you have a high-growth, high-retention product, you should actively pursue multiple acts to ensure continued growth.
- Within your company, individual product features may grow differently than your overall product and can affect your overall understanding of success.
Follow us on Medium for weekly updates.
This work is a product of Sequoia Capital's Data Science team. Jamie Cuffe, Avanika Narayan, Chandra Narayanan, Hem Wadhar and Jenny Wang contributed to this post. Please email data-science@sequoiacap.com with questions, comments and other feedback.
